When you monitor data traveling through your computer’s serial ports, you can get it shown in different visualizations as long as you use a dedicated COM port analyzer app. With RS232 Monitor software by Electronic Team, you have several advanced options for displaying captured serial data. Depending on your needs, the data can be shown as lines of text, as ASCII characters, recorded IRPs, etc.
Every viewing mode has its own advantages, and now we’ll see how each of the visualizers differs from the other ones.
Session visualizers
Table View
This visualizer makes it possible for you to see sniffed RS232 port data as a table consisting of recorded IPRs.

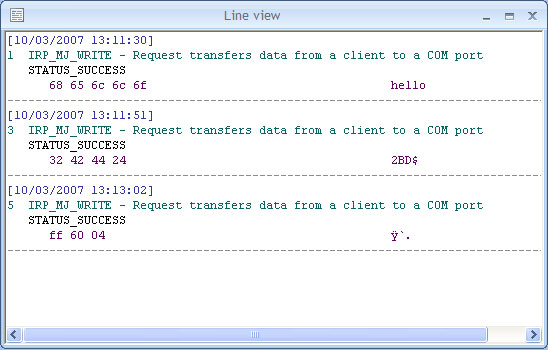
Line View
In this mode, each request received or sent by a monitored COM port will be shown with more details. The data will be displayed as lines of plain text.

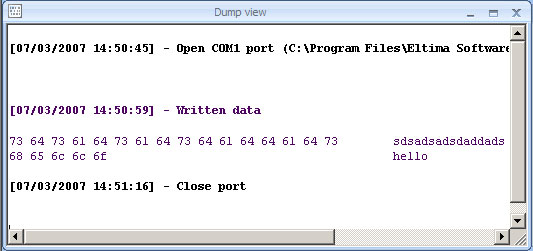
Dump View
Dump view displays RS232 data in hexadecimal and string formats. In addition, it records the time when an entry is saved, when the port is opened and closed.

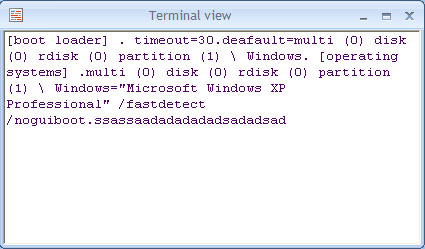
Terminal View
Electronic Team’s RS232 Port Monitor also allows you to view all captured data in terminal mode. Working as a text console, this visualizer will show serial data as ASCII characters.

Modbus view
It is noteworthy that the Modbus protocol is very widely implemented for sending data over serial lines. And when it comes to RS232 monitoring and sniffing, there’s no better solution than RS232 Analyzer developed by Electronic Team Inc. The utility can work with both Modbus RTU and Modbus ASCII protocols. Thanks to the app’s convenient RS232 display feature, you’ll be able to capture, decode and see Modbus messages right in the session monitoring window.


